Visualization using Matplotlib and Seaborn
Learn how to pick the right visualization technique and master the art of presentation by concisely reporting the findings
Course is not enrollable

1
Weeks

2
hrs/day

4.6K
Students
COURSE OVERVIEW
Master these skills
Skills covered
Data visualisation
Context visualisation
Plots
Line charts
Bar graphs
Box plot
Histogram

Level & pre-requisites
Beginner Level
No coding experience required
Visualization using Matplotlib and Seaborn Preview Video

Level & pre-requisites
Beginner Level

No coding experience required

Skills covered
Data visualisation
Context visualisation
Plots
Line charts
Bar graphs
Box plot
Skills covered
Histogram
Level & pre-requisites
Beginner Level
No coding experience required
Skills covered
Data visualisation
Context visualisation
Plots
Line charts
Bar graphs
Box plot
COURSE HIGHLIGHT
Benefit of mastering this course
Possess the ability to collect, organize, analyze, design, visualize data, and draw evidential conclusions


THE ADVANTAGES
Why take SkilloVilla's courses

World class curriculum designed by experts
Learn skills that matter in the real world with a curriculum made for the needs of the industry

Learn with case studies from the industry
Solve real life case studies, learn by applying core concepts to real problems

Showcase your skills with industry recognized certificate
Share your certificate and tell the world about your skills. Get certified!

Courses designed
by experts
Courses designed by experts


Course is not enrollable
SYLLABUS
SkilloVilla's world-class curriculum
CHAPTER 1
Data Visualisation
90 mins
5 Video
1 Reading
2 Quiz
CHAPTER 2
Plotting Data using Matplotlib
75 mins
5 Video
1 Reading
2 Quiz
CHAPTER 3
Plotting Data Using Seaborn
60 mins
2 Video
3 Reading
Speak to career counselors
Book a session, ask your doubts away
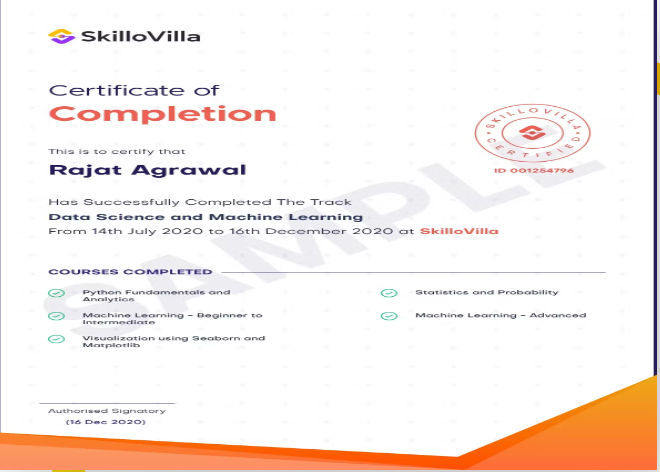
CERTIFICATION
Get certified to become a pro!
View Certificate
Certification recognized in 300+ companies
Prove that your skills are certified to employers
Be a recruiter-magnet in LinkedIn with your certifications
Course is not enrollable
TESTIMONIALS
Users say

Raj Golhani
Excellent content and great mentorship! I had no clue how to get a job in data. SkilloVilla helped me not only learn from very scratch but also helped me understand practical applications through expert driven live classes. Thanks you SkilloVilla team and Deepak Sir for supporting me till I got placed.

Hardik Kaneriya
SkilloVilla’s Data Science Track helped me switch career. Live classes and top notch courses really helped me. And the best part was the resume preparation and mock interviews drills which created a virtual interview environment and helped me prepare well for actual interviews

Anshul Gupta
The curriculum is really best in class. I learnt all the necessary practical concepts and SkilloVilla team helped me get placed at Flipkart. It's a great place to learn directly from industry experts and sharpen your skills. Really recommend it!

Vaibhav Jaiswal
SkilloVilla played a very important role in starting my career right. Combination of videos, live classes and projects helped me understand the concepts throughly. Live Classes by experts made the learning process very interesting and taught me real life application. Very well-structured program.
Raj Golhani
Excellent content and great mentorship! I had no clue how to get a job in data. SkilloVilla helped me not only learn from very scratch but also helped me understand practical applications through expert driven live classes. Thanks you SkilloVilla team and Deepak Sir for supporting me till I got placed.
Hardik Kaneriya
SkilloVilla’s Data Science Track helped me switch career. Live classes and top notch courses really helped me. And the best part was the resume preparation and mock interviews drills which created a virtual interview environment and helped me prepare well for actual interviews
Anshul Gupta
The curriculum is really best in class. I learnt all the necessary practical concepts and SkilloVilla team helped me get placed at Flipkart. It's a great place to learn directly from industry experts and sharpen your skills. Really recommend it!
Vaibhav Jaiswal
SkilloVilla played a very important role in starting my career right. Combination of videos, live classes and projects helped me understand the concepts throughly. Live Classes by experts made the learning process very interesting and taught me real life application. Very well-structured program.
FREQUENTLY ASKED QUESTIONS
Read more to know more 
What is the difference between Tracks and Courses?
Can you elaborate on the employment assistance that I will receive?
What is the mode of teaching?
Will there be live classes?
Will I receive a certificate for completion of the course/track?
Will I get lifetime access to the content?
Do you guarantee a job at the end of the track?
Why should I choose SkilloVilla's Data Analytics career track over other online analytics courses / online data analytics certification program?
Why Should I choose SkilloVilla's Data Science Career track over any other online data science degree?
Why should I choose SkilloVilla's Data Analytics career track over other online data analytics certificate program?
Why should I choose SkilloVilla's Data Science career track over other online data science certification?

Still have questions?
Request a callback to get in touch with our academic counsellors.
Start your journey here